Advertisement
Advertisement
A woman walks past an electronic board displaying the Hang Seng index in Central. Photo: SCMP
Opinion
The View
by Stephen Vines
The View
by Stephen Vines

Just how accurate a picture of the Hong Kong stock market does the Hang Seng Index really give us?

It is quite possible to argue the rarely-cited Composite Index is a far better proxy, given it has four times the constituents
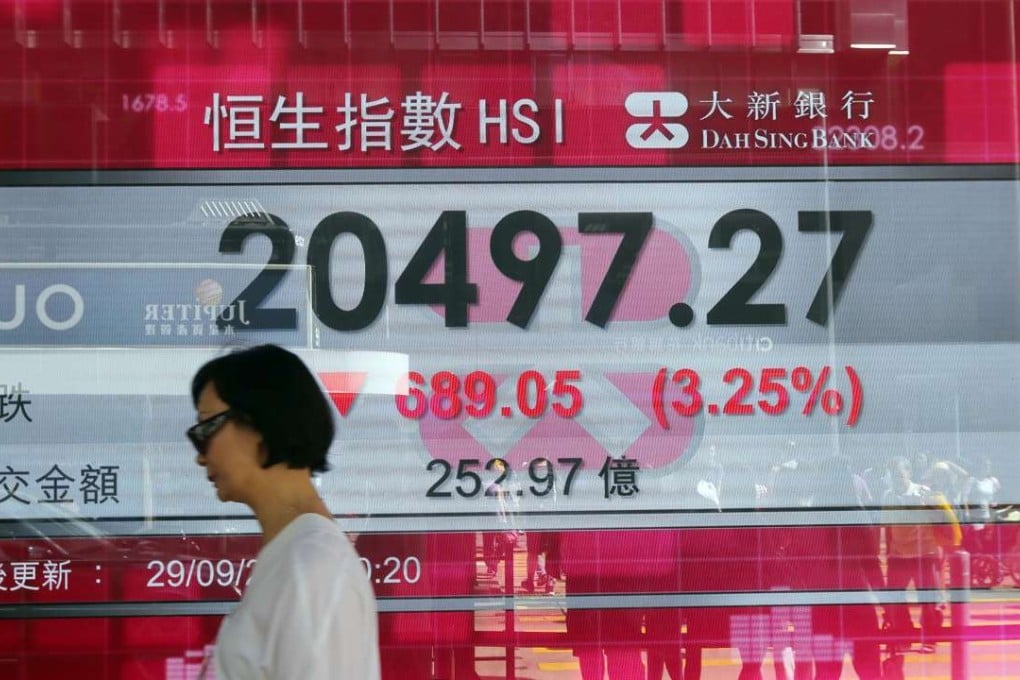
Every day news bulletins make a point of telling listeners how the major benchmark indices have performed. But does the Hang Seng Index, for example, give an accurate picture of the Hong Kong stock market?

Moreover how accurate are other major benchmark indices in furnishing an accurate reading of the state of the markets?

Both London’s FTSE and New York’s DJIA are, if anything more misleading than the HSI, which is almost unthinkingly used as the point of reference for assessing the strength of the local market and is also widely used as a proxy for assessing the state of the economy.

The Hang Seng Index has 50 constituent companies. It embraces the largest and most liquid stocks in the local market, very much dominated by finance companies, which account for almost 48 per cent of the weighting, followed a distant second by information technology companies, just three of them, accounting for 11.3 per cent of the weighting, in third place are 10 property and construction companies, which account for just over 10 per cent of the weighting – my how the mighty have shrunk!

There are only two Hong Kong companies in the top ten of the HSI’s weighting list, HKEX, that’s the Hong Kong Stock Exchange itself and CKH Holdings.

Just two other companies, British-based HSBC and the mainland-based Tencent, account for almost 21 per cent of the entire weighting, most of the other leading companies in the index are either mainland based or mainland controlled.

Moreover how accurate are other major benchmark indices in furnishing an accurate reading of the state of the markets?

The Hang Seng Index has particular oddities because while the property components are largely Hong Kong based the other parts of the index really tell you more about mainland companies and their varying fortunes.

The fine folk who run the stock exchange will brandish this information as proof of the way in which Hong Kong has become a capital raising and trading centre for the mainland.

The HSI therefore reflects the reality that mainland counters now dominate the market but companies, like Tencent, for example, have relatively little business in Hong Kong and so it rather absurd to see this index as somehow being a proxy for the local economy.

It is quite possible to argue that the Hang Seng Composite Index with 473 constituents, covering 95 per cent of the main board’s weighting, is a far better proxy although this index is rarely cited for this purpose.

Does it matter? The answer is yes and no.

Yes, because the advent of tracker funds have forced major investors into holding the constituent stocks of the main indices, a trend that has expanded enormously. Other fund managers also rely heavily on main indicator indices for their allocation of funds.

Investors in these funds may therefore be under the impression that they are holding portfolios that are entirely representative of the markets where they are listed but this is not always the case.

Unsurprisingly narrow benchmark indices tend to rise and fall in tandem with the wider indices but their returns are not the same.

The Hang Seng Index has particular oddities because while the property components are largely Hong Kong based the other parts of the index really tell you more about mainland companies and their varying fortunes

Last year, for example, the local market’s rather lack lustre performance resulted in the HSI rising by a 0.39 per cent while the composite index fell by minus 0.89 per cent; this is something of a gap.

However there is a familiar pattern of disparity. The Dow Jones Industrial Average has demonstrated greater disparities, lagging 30 percentage points behind the Standard & Poor’s 500 which has risen 234 per cent since the 2008 meltdown. More recently the Dow has been doing better than the S&P, either way they are doing different things while allegedly representing exactly the same market.

An even greater disparity is frequently seen between the much better performance of the FTSE100 in London compared with the more broadly based and locally focused FT250. This is mainly explained by the fact that the narrower index is heavily dominated by overseas companies whose shares become cheaper when sterling falls.

In the wake of the Brexit campaign those favouring leaving the European Union have pointed to the healthy performance of the FTSE100 to argue that the economy has become more buoyant in the wake of the vote. This is pretty much nonsense but it is much repeated nonsense.

Weighting of these indices is a complex and changing business, which sometimes produces anomalies that don’t make sense. A famous example came after the DJIA was expanded from 12 to 20 stocks in 1914, leading to a one-day 24 per cent market plunge.

It is somewhat strange that little attention is paid to the nature of the indices that are supposed to reflect market performance; they do so in general but with significant discrepancies. There is no need to get over excited here but in the interests of clarity and better understanding it is worth contemplating this matter.

This article appeared in the South China Morning Post print edition as: Pattern of disparity
Post