Advertisement
Advertisement
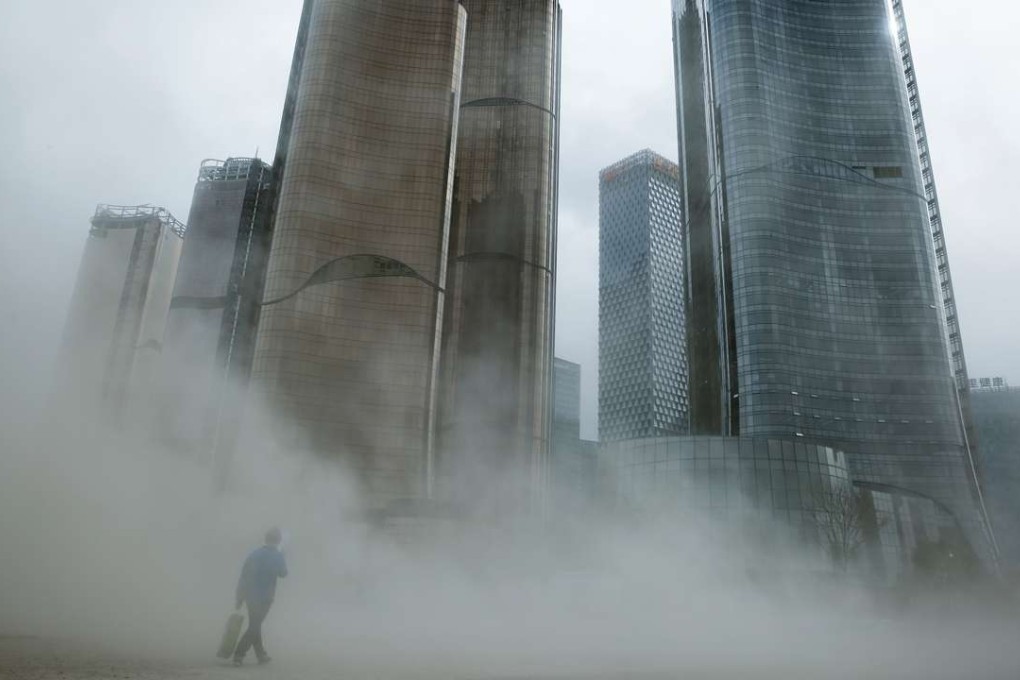
China pumped up domestic credit over a five-year period following the global financial crisis at the fastest pace on record. Photo: Reuters
Opinion
Andrew Brown
Andrew Brown

China’s credit excess is unlike anything the world has ever seen

‘China’s investment efficiency has deteriorated to the point that...every 1 yuan in new fixed asset investment is now creating only 7 fen in GDP’
From a global macroeconomic perspective, we encourage readers to consider that the world is experiencing an extended, rolling process of deflating its credit excesses. It is now simply China’s turn.

For context, Japan started deflating their credit bubble in the early 1990s, and has now experienced more than 20 years of deflation and very little growth since. The US began its process in 2008, and after eight years has only recently been showing signs of sustainable recovery. The euro zone entered this process in 2011 and is still struggling six years onward. We believe China is now entering the early stages of this process.

Having said that, we believe that Chinese authorities have a viable plan for deflating their credit excess in an orderly fashion. Please stay posted as we will review this multi-pronged, market-based approach in our next column.

For now, let’s turn our attention to the size of the credit excess that China created and why we estimate it to be the largest in the world.

China created 139 per cent of GDP in new credit between the first quarter of 2009 and the third quarter of 2014

A credit excess is created by the speed and magnitude of credit that is created – if too much is created in too short a time period, excesses inevitably occur and non-performing loans (NPLs) emerge.

To illustrate the credit excess that has been created in China, let’s review several key indicators, including the: 1) flow of new credit; 2) stock of outstanding credit; 3) credit deviation ratio (i.e., excess credit); 4) incremental capital output ratio (efficiency of credit allocation).

The chart below shows the amount of credit created as a percentage of GDP during the five years prior to major downturns globally.

The US created 58 per cent of GDP between 2002-07, and the global financial crisis followed.

Japan created credit equivalent to the entire size of its economy between 1985-90 and subsequently experienced more than 20 years of deflation (admittedly reflecting the lack of restructuring).

Thailand created a significant real estate bubble between 1992-97 and ended up with about 45 per cent NPL ratios.

Photo: Reuters

Spain created credit equivalent to 116 per cent of GDP between 2002-07 and still is trying to address a 20 per cent unemployment rate.

China created 139 per cent of GDP in new credit between the first quarter of 2009 and the third quarter of 2014 (when GDP growth peaked), far greater than what was created in other major credit bubbles globally.

This unprecedented flow of new credit was predominantly in infrastructure and corporate credit. The result is that China’s corporate debt-to-GDP is too high and must be addressed, which authorities are now doing.

Another important measure to assess the amount of credit in the economy which is “excessive” is the credit-to-GDP gap, as reported by the Bank of International Settlements. This ratio measures the difference between the current credit-to-GDP ratio in an economy against its long-term trend of what is necessary to optimally support long-term GDP growth. It is akin to measuring the amount of credit that is productively deployed into an economy.

This metric is used by the Basel III framework in determining countercyclical capital buffers for a country’s banking system when credit creation becomes too fast (i.e., high credit growth requires higher capital ratios for banks).

A credit-to-GDP gap above 10 per cent of GDP is considered risky and requires the maximum additional 2.5 per cent of tier one capital as a countercyclical buffer under Basel III.

A credit-to-GDP gap above 10 per cent of GDP is increasingly problematic as any new credit extended above that level produces progressively less GDP and is a source of future NPLs.

Out of the 43 countries currently measured by the BIS, China has the largest credit-to-GDP gap (by orders of magnitude) at 30 per cent of GDP. This is equivalent to US$3.1 trillion in excess credit.

Finally, to show that the pace of credit creation will necessarily slow, thereby exposing misallocated credit and driving the emergence of new NPL formation, we turn to the deterioration in China’s incremental capital output ratio.

This ratio is the measure of the number of units of input required to produce one unit of GDP.

For the 15 years prior to the credit impulse in 2009-14, China’s incremental capital output ratio has been consistently between two and four. Meaning that two to four yuan in fixed asset investment created one yuan in GDP.

But as a result of the credit-driven economic growth model, and the excessive credit that has been created (and the subsequent excess capacity in the industrial economy), China’s investment efficiency has deteriorated to the point that its incremental capital output ratio is now over 13.

Said another way, every 1 yuan in new fixed asset investment is now creating only 7 fen in GDP. Meaning that new credit creation is having an increasingly lower transmission into GDP growth. Simply put, credit growth must necessarily slow and be redirected towards more productive activities.

While all of this data points to a debt bubble in China, we remain confident that authorities have a viable plan to address the excess and rebalance the economy in an orderly fashion. Please see our next article on this topic on May 6.

Andrew Brown is a partner for macro and strategy at ShoreVest Capital Partners

This article appeared in the South China Morning Post print edition as: China’s credit excess is unlike anything the world has seen
Post