Why school graders stay away from the bell curve
Someone recently asked me an interesting question - do schools grade on the bell curve? When I replied in the negative, I was asked why not since several well-known standardised tests allocate marks or grades this way.
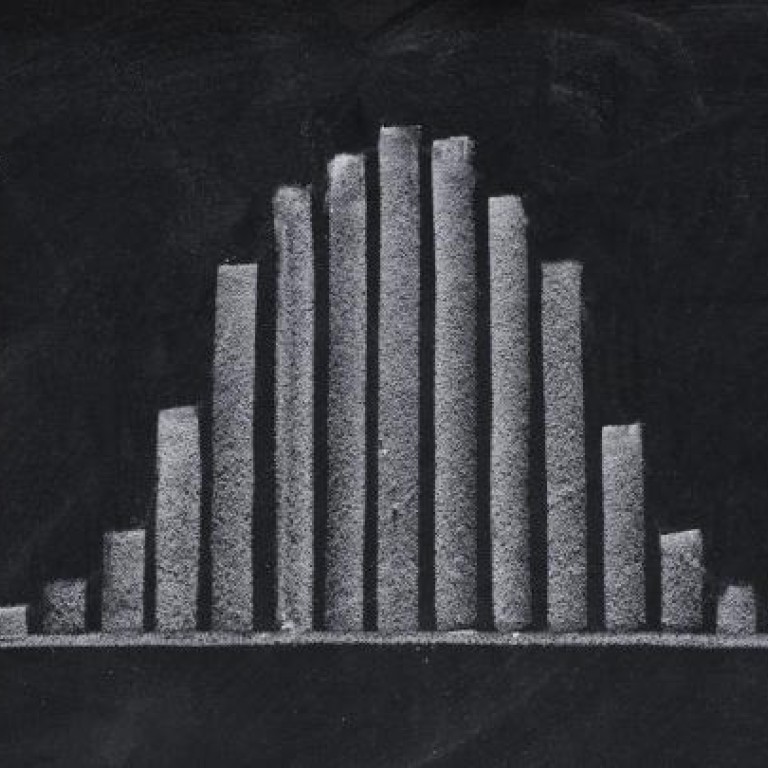
Commonly referred to as a normal distribution (or a Gaussian distribution, after German mathematician and physicist Carl Friedrich Gauss), the curve graphically represents statistical events. The peak of the curve or the top of the bell, shows the most probable event or, in education, the mean.
In university and some standardised tests, grading on a curve is a statistical method of assigning grades designed to yield a predetermined distribution among a group of students.
Because this involves rating students' performances in relation to that of their classmates, curve grading has also come to refer to any grading method that uses comparisons of students' performances, although it may not actually apply a bell-shaped frequency distribution.
Grading on a curve came into existence because of the subjectivity teachers show in marking student work. Pioneering research by Daniel Starch and Edward Charles Elliott in 1912 showed that English teachers assigned widely varied percentages to two identical papers from students. Some teachers focused on elements of grammar, style and neatness; others considered only how well the message of the paper was communicated. A subsequent study on geometry papers by the same researchers confirmed this subjectivity. Some teachers deducted marks only for inaccurate calculations and wrong answers while others deducted marks for neatness and spelling as well.
Evidence of such variation in grading led to a move away from percentage scores to scales that had fewer and larger categories.
Standardised tests including the International Baccalaureate exams enable us to compare the performance of students with each other in a relatively efficient way. But how much can such tests tell us about what students actually know?
One year, for instance, the cut-off mark of getting a grade 7 in higher level physics was 72 points, while the cut-off for higher level biology was 79 points.
In a tough final examination where overall student performance is fairly poor, it is unfair and meaningless to pass, say, three quarters of a class. If that many students fail, it is a good indication that the test was abnormally difficult and that students should be given the benefit by adjusting the grades accordingly.
Likewise, if an exceptional number of students do well, it is a good indicator that the test or exam was not challenging enough and that the grades need to be adjusted.
The IB, an internationally respected programme, operates this way. Scores are allocated in relation to the performance of every other IB student in the world. So when students procure a 40 per cent mark on their higher level physics exam, some may view it has having failed. But the IB programme and many universities see it as a pass if most people achieved a similar mark.
The problem with the grading curve in schools is that if there are only 22 students it will not represent a range of abilities and one group of students could cluster at either end of the curve. This is less likely to happen with IB exams because of the larger sample size involved.
There is disagreement about whether standardised tests accurately measure intellectual merit because racial and gender stereotypes known to the test-takers interfere with intellectual functioning, according to research by Stanford University psychology professor Claude Steele. As a result, grading and reporting in schools are generally conducted in reference to learning criteria and specified outcomes and not "on the curve".
So here is my "statistical" rationale as to why schools don't generally grade on a bell curve. There are no specific criteria that define an average student. It would be difficult to curve school students because without an average we have no bell curve. And for the same test taken every year, the peak of the bell curve "shifts" because the average varies.
So if there is no average, then there are no mediocre students and we have no choice but to accept the diversity in our student population, and that each child is unique.
Anjali Hazari teaches IB and IGCSE biology at the French International School in Hong Kong

