
Source:
https://scmp.com/business/markets/article/1874711/chart-day-sensitive-times-mumbai Markets
Chart of the Day: Sensitive times in Mumbai

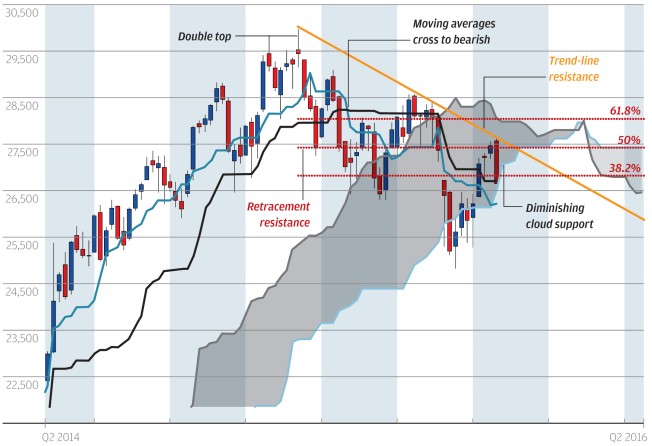
Mumbai's Sensex index is dangerously poised on Ichimoku cloud support which, as it thins dramatically at year-end, means it is more likely to give way. Noted earlier was the double top, which in turn forms part of a larger topping pattern that dominated the last 12 months. Last week's sharp rejection from trend-line resistance at the 50 per cent retracement resistance area suggests November is likely to be dominated by price falls. A weekly close below the nine-week moving average should see a quick slide to the 26-week moving average (red line) and lead eventually to a re-test of September and October's lows. Note that this chart has clearer patterns than other Asian indices.
Nicole Elliott is a technical analyst