Advertisement
Advertisement
China pollution
Get more with myNEWS
A personalised news feed of stories that matter to you
Learn more
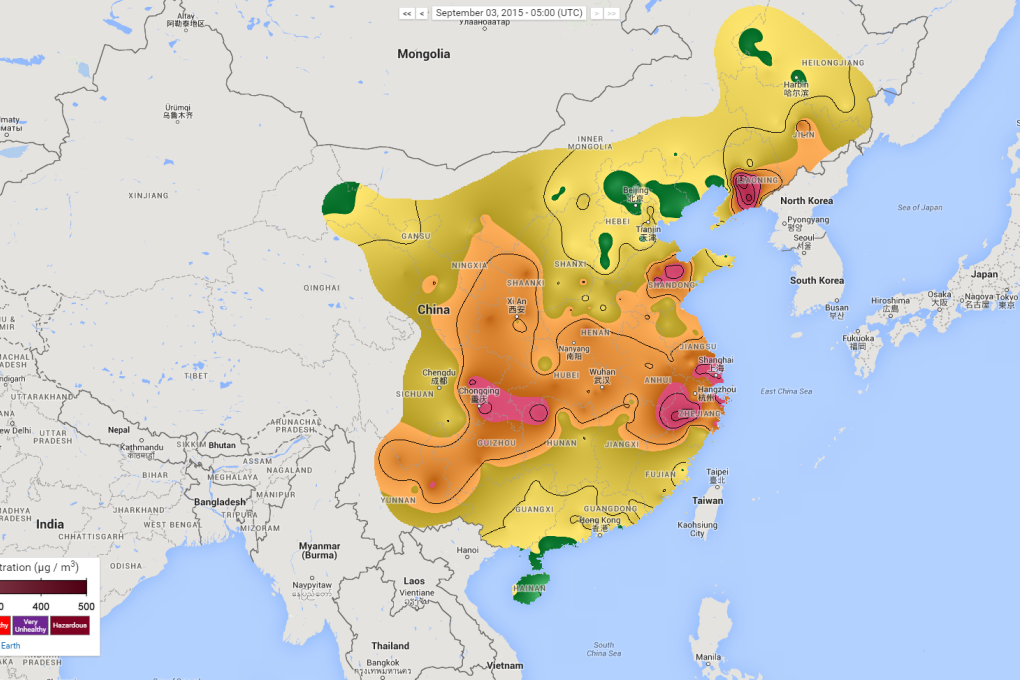
A map of pollution levels across China, as of September 3, 2015. Photo: SCMP Pictures

China's pollution on Google Maps: Smog data shows 92 per cent breathe in unhealthy air ... but how does Hong Kong fare?

Google may be blocked for Chinese users, but that hasn’t stopped scientists from using the US internet giant's services to help map China’s pollution problem.

Scientists working at the University of California Berkeley and Nanjing University previously mapped hourly pollution data from over 1,500 sites across China - including Hong Kong - to produce a comprehensive smog map of the country’s heavily populated eastern provinces.

“The greatest pollution occurs in the east [of the country], but significant levels are widespread across northern and central China and are not limited to major cities or geological basins,” Robert Rohde and Richard Muller wrote in their paper, published in the journal .

During the period covered by the scientists’ paper, from April to August 2014, 92 per cent of the population of China experienced at least 120 hours of unhealthy air (according to US environmental protection agency standards) and 38 per cent experienced unhealthy air on average.

The scientists calculated that the observed air pollution is calculated to contribute “to 1.6 million deaths [per] year in China” or around 17 per cent of all deaths.

Rohde and Muller have now adapted the method used to gather data for their paper, and used it to create a plug-in for Google Maps to display live pollution data across much of China.

“[The] map provides near real-time information on particulate matter air pollution less than 2.5 microns in diameter (PM2.5),” they wrote.

“Under typical conditions, PM2.5 is the most damaging form of air pollution likely to be present, contributing to heart disease, stroke, lung cancer, respiratory infections, and other diseases.”

The researcher's map for today shows there are several pockets of northern China marked in green which means 'good air'. Hong Kong is also clearly identified as having 'good air'. Large swathes of eastern China have 'moderate' air. 

Hong Kong has had its share of choking smog, according to the latest air quality index report from the Environmental Protection Department. Pollutants including nitrogen dioxide, ozone and PM2.5 exceeded the government limits in various areas of Hong Kong last year, according to the report.

PM2.5 are microscopic particulate matter smaller than 2.5 microns that can lodge deep inside a person's lungs and cause health problems in the long term. It hit a high of 119 micrograms per cubic metre, exceeding the 75-micrograms a day limit.

High levels of nitrogen oxide – a compound mostly coming from vehicle exhaust – peaked at 429 micrograms per cubic metre last year in Causeway Bay. This was more than double the limit of no more than 200 micograms per hour set by the government.

Post