Advertisement
Advertisement
Pedestrians walk past the New York Stock Exchange (NYSE) in New York, US. Photo: Bloomberg
Opinion
Jake's View
by Jake Van Der Kamp
Jake's View
by Jake Van Der Kamp

Does an inverted yield curve spell trouble for US economy?

A discrepancy in interest rates for short and long-term debt instruments have in the past foretold recession and an impending collapse of the US stock market

Here is an indicator of trouble to keep your eye on if present trends continue. It is called an inverted yield curve and in the past it has always spoken prophecy.

For this we have to go to the financial marketplace in the United States. It is the only one liquid enough for this curve of fate to show itself reliably. I have to exclude those markets taken to Never Never Land by monetary sorcery at the European Central Bank and the Bank of Japan.

The idea here is that short-duration debt instruments in normal times trade at lower interest rates (or yields) than long- duration ones do. You normally get a higher rate for
10-year than for three-month debt. It stands to reason. More can go wrong for you over 10 years than over three months.

But every now and then the whole picture goes awry and the difference between short-term and long-term rates narrows, eventually even reaching the point where short-term rates are higher.
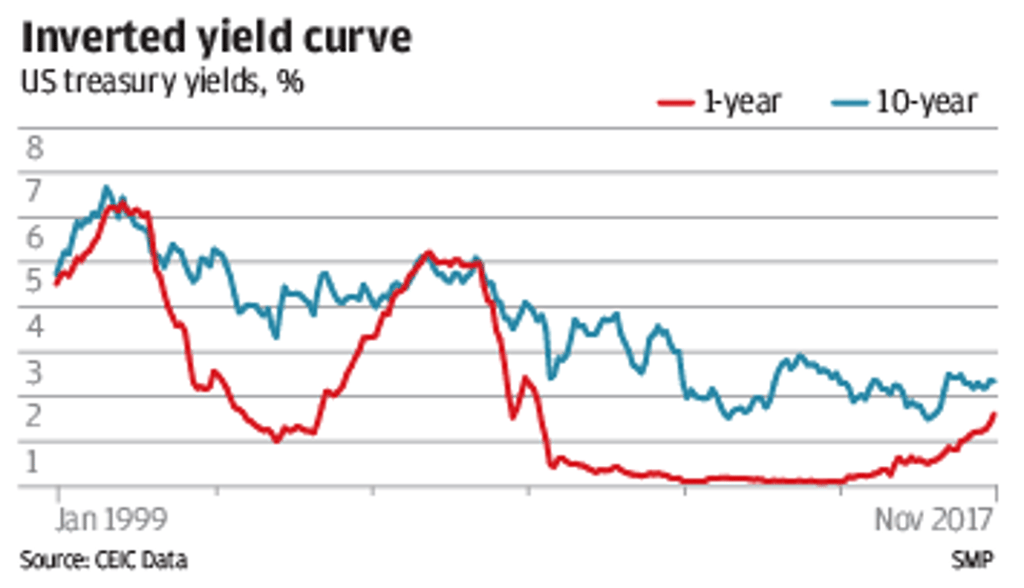
Now turn to the chart. The blue line shows you the historic yield on the 10-year US Treasury and the red line the yield on the one-year US Treasury. There are more maturities in US treasuries but these two will do.
Graphic showing the inverted yield curve. Graphic: SCMP

What you see here are two classic examples of an inverted yield curve, one in early 2000 and one lasting from mid-2006 to mid-2007. Each of them accurately foretold recession and an impending collapse of the US stock market.

You may say that what they actually show you is monetary policy in the form of where the Federal Reserve Board sets its short-term federal funds rate and there is some truth to this. In both cases, particularly in 2006, the Fed tightened and the fed funds rate went way up.

But the Fed does not control the longer-term rates. The inverted yield curve in both cases came about because longer-term demand for debt just was not there. The market was hesitant about the future and it ignored the Fed signals. The market got it right and the Fed got it wrong (again).

Take note also that financial markets find an inverted yield curve particularly stressful because every time a number of oh-so-clever financiers have funded themselves with short-term debt and put it back out again on long term, pocketing the difference in interest rates. An inverted yield curve crushes them.

Another feature of inverted yield curves is that every time the pundits mostly say it is different this time and the yield curve has it wrong. They may be right. Eventually they will be. There is always a first time. But I’m sticking with the track record.

And now to the punch line. Look at what is beginning to shape up on the right side of the chart. The Fed has started to raise interest rates and the market has responded at the short end. But the long end has paid no attention. The yield curve has flattened. Keep your eye on this one.

Post