Things are getting crazy, but not quite crazy enough to call the next market crash
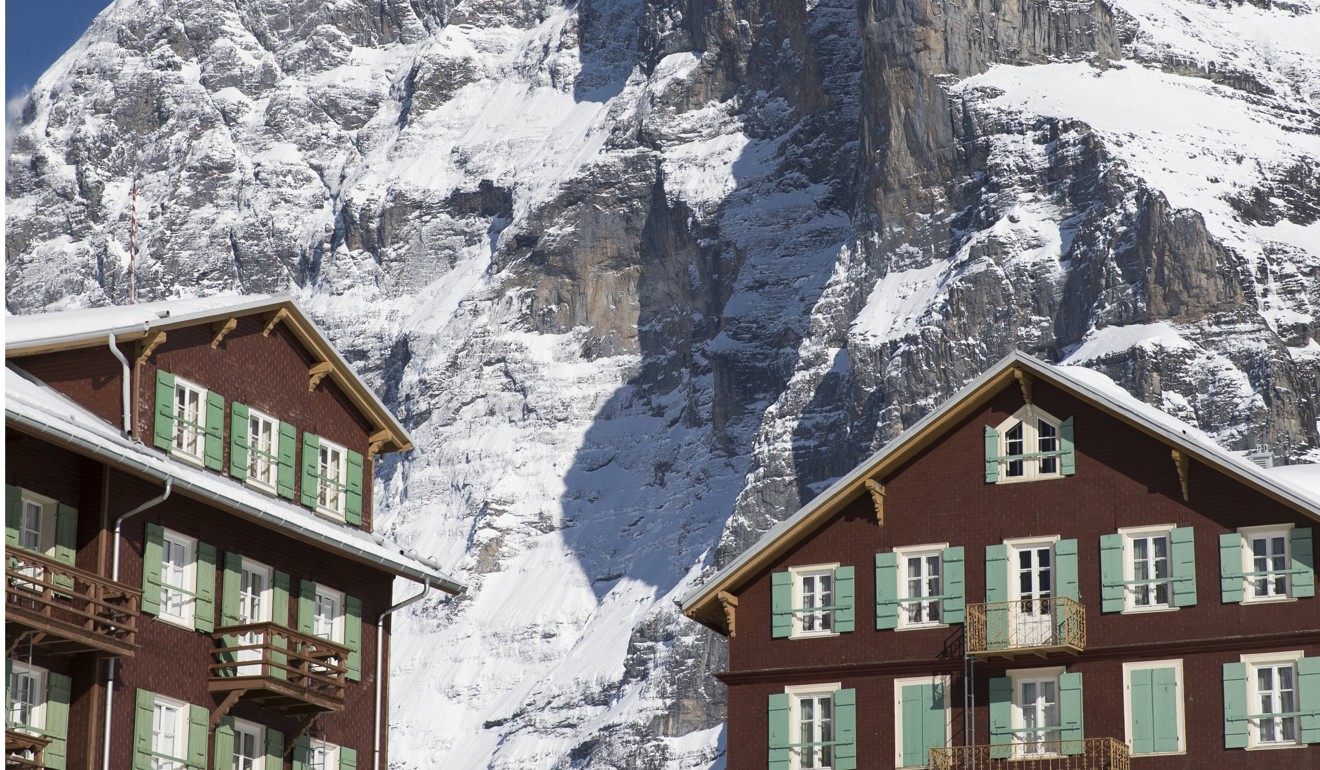
‘The top is often associated with asset price volatility following a sharp rise that looks like the North Face of the Eiger at the end of a long bull market’
We know the next financial crash is coming. The Seven-Year Itch between busts has worked like clockwork since the 1950s – and we are now 10 years away from the last global financial crisis. Each month, I shall trace the progress of the crash a decade ago to find pointers for the next.
Last week, the South China Morning Post and the Financial Times both headlined bearish predictions – so we know a crash is not coming anytime soon! Few expect a crash when it comes. Apocryphally, JPMorgan recognised the top of the market in the 1920s when his shoeshine boy started giving him financial advice. Keeping an eye on these pointers is like identifying dogs wailing and snakes emerging just before an earthquake. It sounds spooky but it just might work.
I well remember buying the house view of my firm, Citi, that the powerful US economy would easily handle a few bad mortgages
This time 10 years ago, we had the first failure of a big subprime lender, New Century Finance. There was no appreciation of the fragility of US mortgage lending or that most small euro nations were already bankrupt.
To the experts at the Federal Reserve, the US Treasury, and the trading desks of the global banks, a few bankruptcies were merely a little local difficulty. I well remember buying the house view of my firm, Citi, that the powerful US economy would easily handle a few bad mortgages.
Exactly 10 years ago this month, the venerable Bear Stearns gated (or closed to redemption) its subprime fund; a grubby product most considered to be beneath its highbrow values. The bellwether US market almost touched its pre-crash all-time high in June 2007. Already, the pointers to the crash were hidden in plain sight. Are those to the next crash visible today?

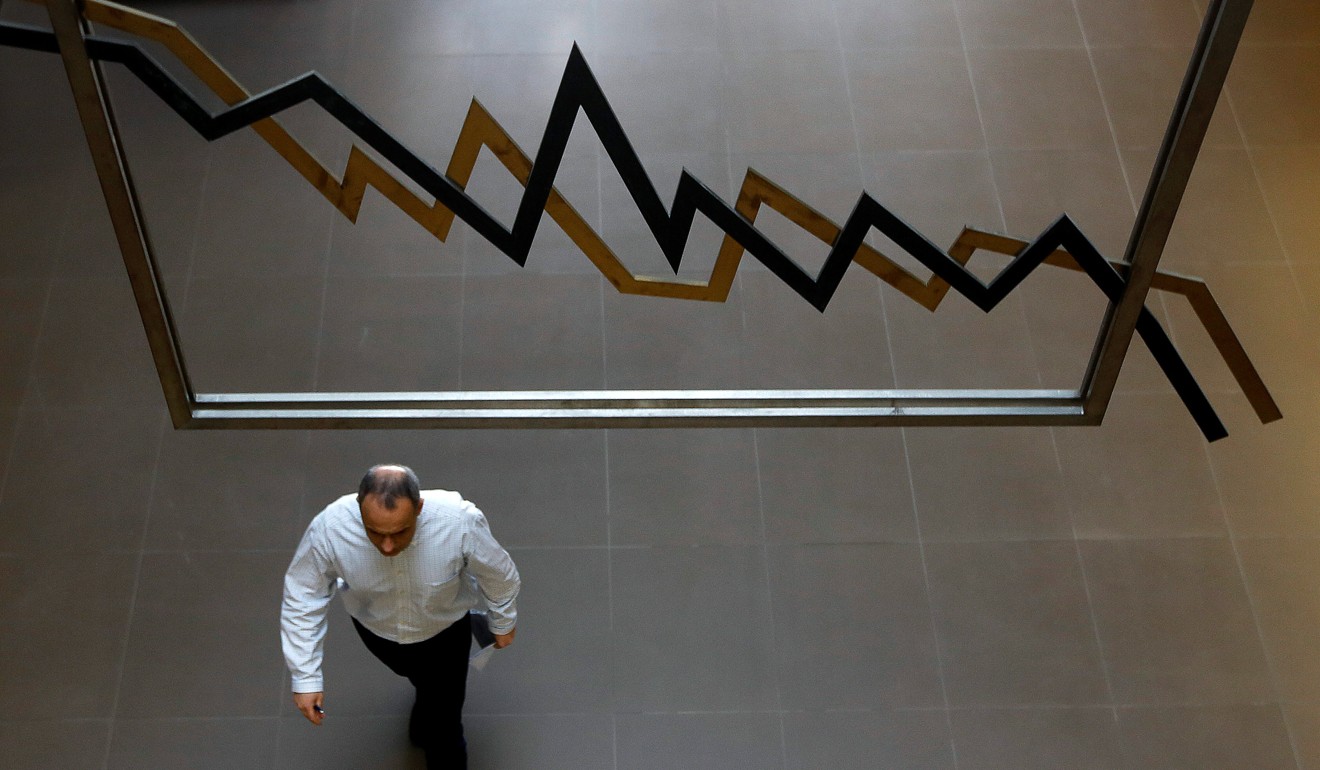
Much can be learned from studying market price action. Markets only have a big bust after an unruly boom; where logic is replaced by red mist. Low interest rates have allowed asset holders to make out like bandits over the past 10 years. Since the February 2009 low, Wall Street is up 218 per cent in US dollars and 230 per cent in euro terms, smashing new highs. It beats working. Hong Kong and Britain have merely doubled in that time. On the other hand, Hong Kong residential property prices are up 172 per cent. But appreciation alone is not a strong enough pointer to a collapse.
The top is often associated with asset price volatility following a sharp rise that looks like the North Face of the Eiger at the end of a long bull market. The summit is characterised by a series of peaks as divided opinions battle it out. The traditional indicator of volatility, the dollar index, traded well above its three-year average from January 2007 – well before the debt crisis hit the fan. That the index is currently trading at about its lowest volatility ever is mildly comforting.

Economic and financial fundamentals that affect the earnings potential of global companies remain upbeat, even taking into account plague, wars and famine.
Price-earnings ratios are creeping towards the mid-20s but before the last crash, they were well over 30. Indeed, I recall the ratio was being substituted for earnings before interest, taxes, depreciation and amortisation ratios (whew!) because the lower figure justified outrageous valuations. That kind of data manipulation is not yet obvious.
Cheap borrowed money has poured a great deal of liquidity into inflated assets. Trump administration policies, yet to materialise, suggest big spending on infrastructure may create more liquidity – and bullishness. Any liquidity squeeze or deleveraging is a vital indicator.
A narrowing of the rally as it continues to rise indicates an increasingly unstable market. High-profile bankruptcies often encourage the narrowing as investors flee to safety of a favoured few stocks. The US rally is still broad with a range of stocks and sectors adding to the index.
At the top of the market crazy things happen. In 1999, start-up America Online took over storied Time Warner, and Royal Bank of Scotland bought ABN Amro in 2006. Watch out for something crazy like Tesla buying General Motors and Ford Motor, or Anbang Insurance Group buying Coca-Cola.
These seven pointers need a trigger; the last grain of sand hitting the pile that makes it collapse.
Crazy times are not yet with us but they remind me of a conversation with an old friend and successful industrialist. When I met him before the last crash, I asked him what he was doing. “I’m a fund manager!” he said proudly. I wondered: “It’s taken me over 30 years of training and experience to become a fund manager – and I still find it hard!”
Richard Harris is a veteran investment manager, banker, writer and broadcaster – and financial expert witness

