Advertisement


Advertisement
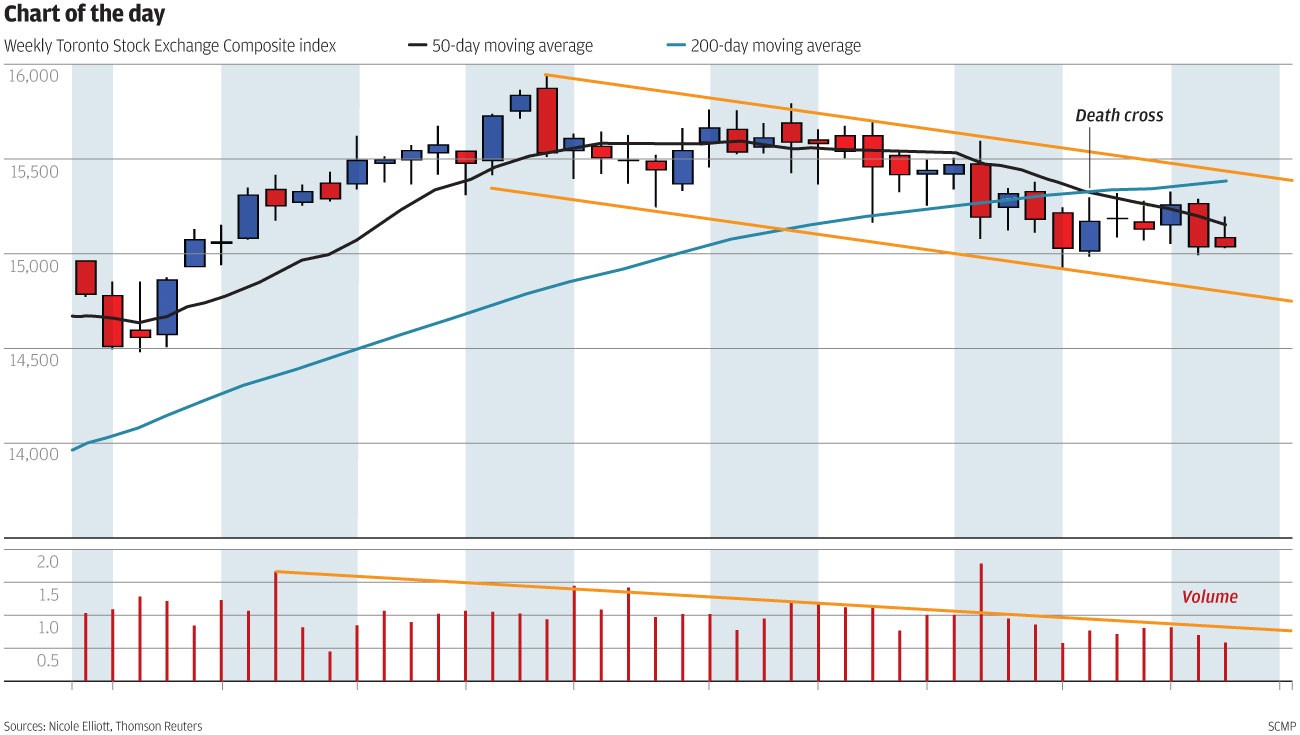
Volumes on Toronto’s stock exchange composite index this summer have been below their long-term mean. This might be due to very low historical volatility or, more likely, down to declining prices since February’s record high. In fact, this index has struggled to hold above the psychological 15,000 level since it first reached that point in 2008, stumbling again there in 2014. Since mid-May weekly closes have been below the 50-day moving average, and since mid-June the average itself has started pointing down. After that weekly closes have also been below the 200-day moving average which lies above the 50-day one. Known as a “death cross” it is a classic sell signal for long-term momentum investors.
Nicole Elliott is a technical analyst

Advertisement