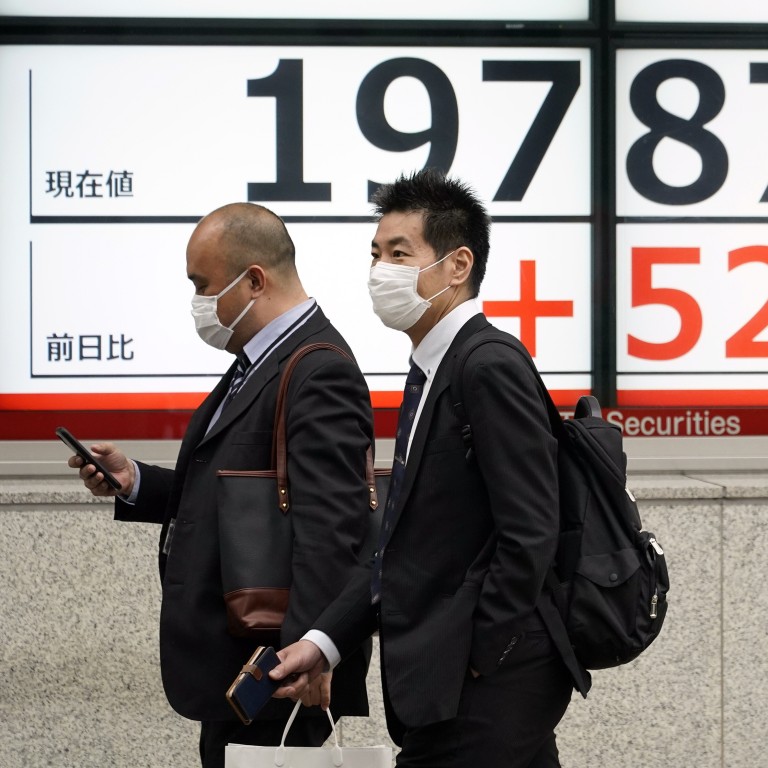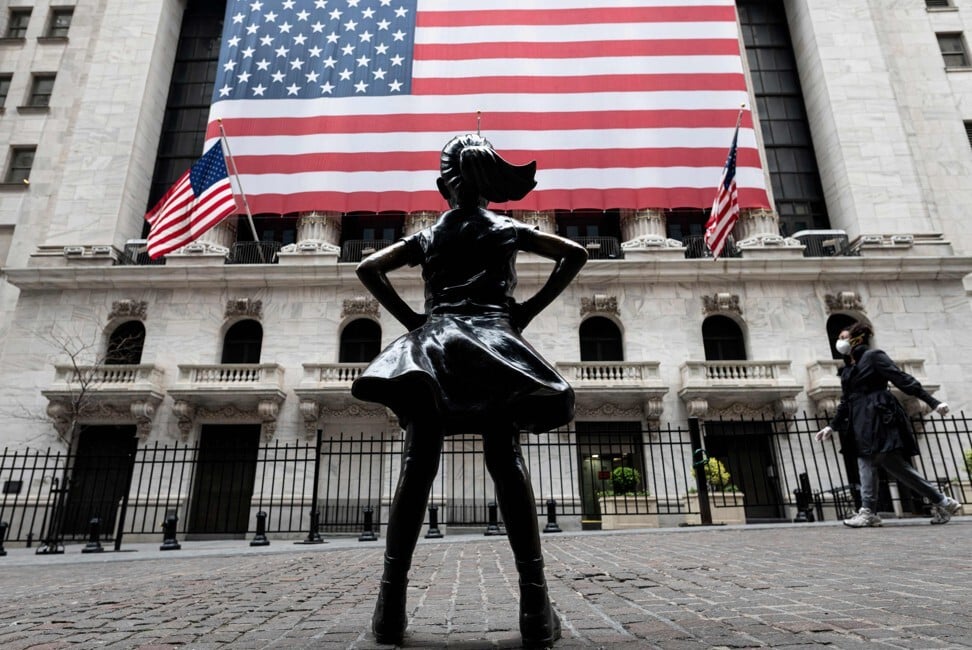
Investors have not seen the back of the Covid-19 market crash, if history is any guide
- The rebound in stocks may seem reassuring, but a look at the biggest bear markets of the past century warns of the likelihood of a ‘post-crash crash’. Given the extent of the contractions all round, it may be prudent to hold out for another market fall
I therefore went back over 100 years to look at what the US S&P 500 index, and its predecessor, have done. I took the nine biggest bear markets, not in terms of a single-day collapse (the kind that generates the headlines), but in terms of the total fall from top to bottom.
We all get frothy at the mouth at a big daily fall, but it is the long, drawn-out falls in value that destroy confidence and wealth.
For instance, the 1929 crash saw the market plummet 43 per cent in just over a month but a grisly, slow-motion implosion from 1930 meant that it took another 22 years for it to crawl up to 50 per cent from its lowest level. That is most definitely an L-shaped recovery.
The U-shaped crashes of wartime 1916 and dotcom 2000 were slightly less painful, taking between four and six years to recover 50 per cent. The 1973 oil shock crash was painful as it took 2½ years to fall and rise, forming a nice “V” shape.
Happily, the 1937 and 1987 crashes took less than two years to fall and recover 50 per cent from the bottom, forming a deeper “V”. Analysts have worked the crash alphabet soup lexicon into retirement as even a “V” shaped recovery is more like a number “7” placed on its back with the long end to the right.

This nicely proves another of Kahneman’s Nobel-winning concepts – the prospect theory, where people fear loss more than they enjoy a gain.
We are left with the crash of 2020, which saw a 34 per cent fall in just 33 days, making it merely the third-fastest shock fall in history. Yet its recovery of 25 per cent from the trough in just 22 days gives it first place in recovery status and a true impression of a “V”.
What does history say about where we go from here? Most crashes have seen a “post-crash crash”, a further leg down, like a W with a very long left arm. Out of the eight completed cycles, four had no “W” and four settled within 3 per cent of the earlier trough; only 1987 was fractionally below. It seems that the first plunge sets a bottom; a second trough is the last chance to buy in the cycle.
China is focused on softening the blow of coronavirus, not recovery
However, investment decision-making is not about how you invest, but what decisions you think everyone else will make; the dilemma of the Keynesian beauty contest. If I think that the market will reach a level 3 per cent above the previous trough, 2,305 on the index, then you can be sure that the rest of the market knows, so the index won’t get there.
So, if you are playing the odds, it is probably worth holding out for another fall – after all, the markets have been hit very hard. By way of another heuristic bias, good fund managers will split the difference, so we might see another bottom, at, say, 2,550.
This time it really is different. Narrative finance would say that the big current story moving markets is the central banker’s “put”; the printing of money every time the market wants to go down that surely saved us this time.
Investors’ irrational faith that they will be bailed out by the irrational US Federal Reserve favours the stock market and US and UK long bonds. The stimulus money will eventually end up there – and in gold, as printing eventually devalues money.
We should remember that the “law of small numbers” means that every crash is different, even if they look similar. In calculating the odds, most investors will feel like the villain faced with arrest and Dirty Harry’s .44 Magnum. “Do I feel lucky? Well do ya, punk?”
Richard Harris is chief executive of Port Shelter Investment and is a veteran investment manager, banker, writer and broadcaster, and financial expert witness
Help us understand what you are interested in so that we can improve SCMP and provide a better experience for you. We would like to invite you to take this five-minute survey on how you engage with SCMP and the news.

