Just how much of a melting pot is Hong Kong, Asia’s World City?
Compared to a decade ago, the amount of non-Chinese ethnic people living in the city has increased by 70.8 per cent
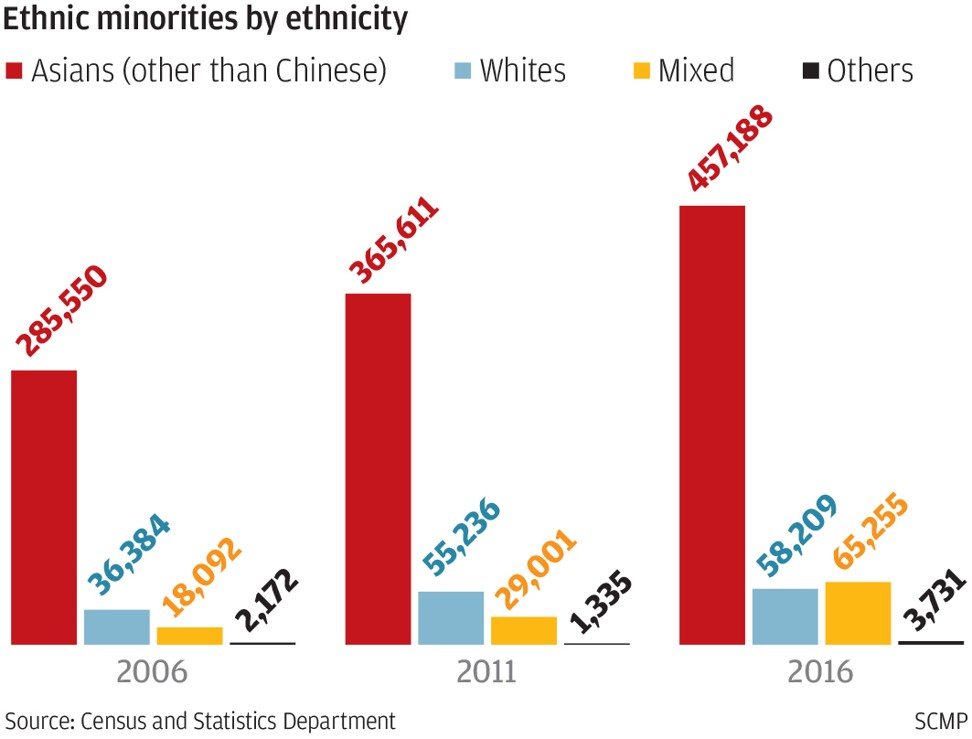
Claiming to be “Asia’s World City”, Hong Kong is a culturally diverse society with people of different ethnic backgrounds. A thematic report released by the Census and Statistics Department last week mapped out the latest condition of ethnic minorities in the city. Compared to a decade ago, the amount of non-Chinese ethnic people living in the city has increased by 70.8 per cent. The government explained the surge was mainly because of increases in the number of Filipinos, Indonesians, South Asians and whites.
How many from ethnic minorities live in Hong Kong and where are they from?
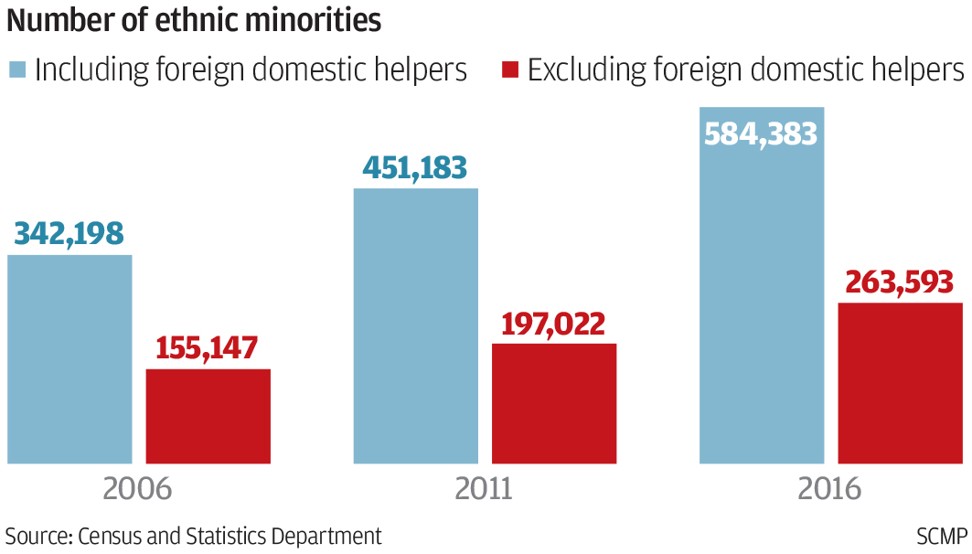
According to the department's latest report, which was based on a population by-census done in 2016, a total of 584,383 people from different ethnic minorities were living in Hong Kong, constituting 8 per cent of the city’s population.
Excluding foreign domestic helpers, the amount of ethnic minorities in Hong Kong also increased by about 70 per cent from 2006 to 2016.
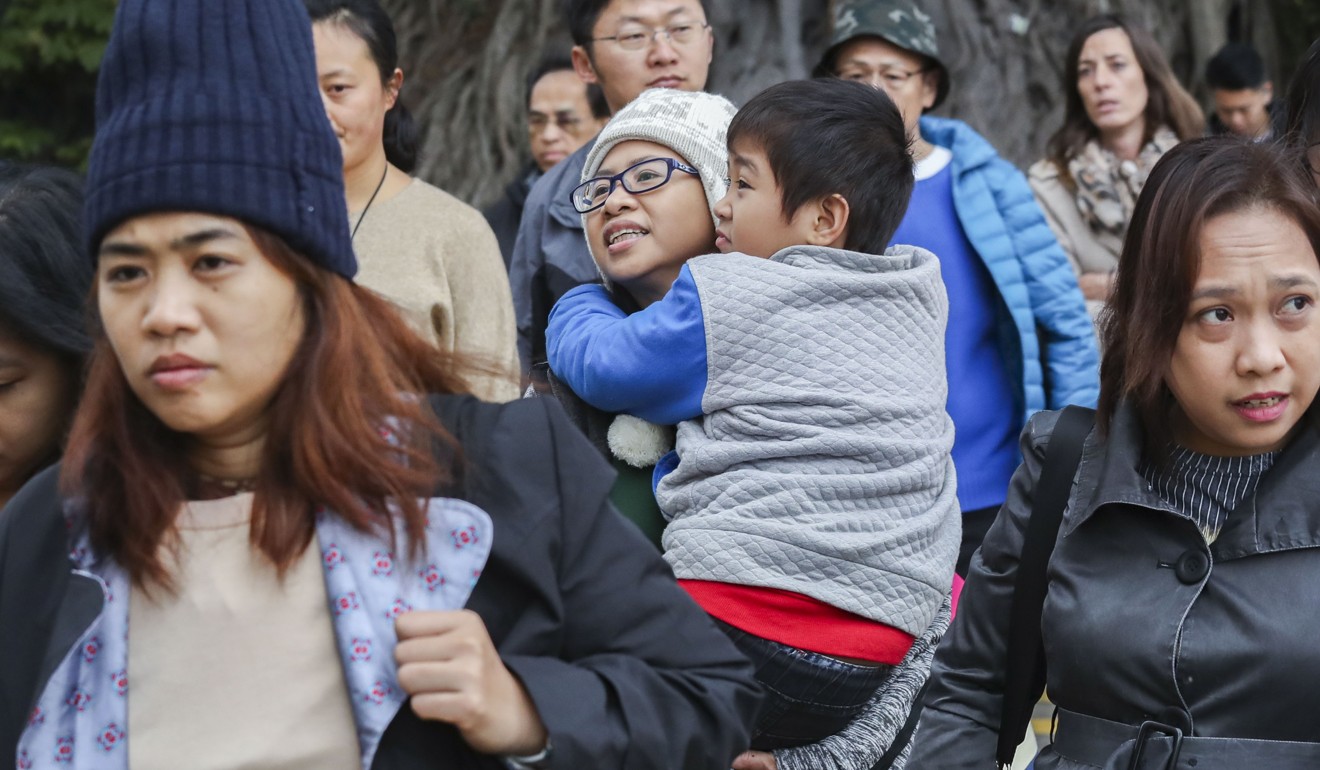
About 80 per cent of all ethnic minorities in the city were from Asia. Most of the non-Chinese residents originated from the Philippines and Indonesia, accounting for 31.5 per cent and 26.2 per cent of the total ethnic minorities population. South Asians, including Indians and Pakistanis, constituted 14.5 per cent of the ethnic minorities population. Around 10 per cent of the non-Chinese population were whites.
Who had better Chinese language skills?
Those who had Chinese connections in their families, or those who were younger, were more likely to be better at the language. According to the report, among ethnic minorities aged five or older, mixed-race people with a Chinese mother or father recorded the highest proportion of those able to read Chinese, at 83.9 per cent. That was followed by Koreans, at 39.8 per cent, and Japanese at 35.1 per cent.
In the five to 14 age group, 64.3 per cent of ethnic minorities were able to read Chinese, the highest figure among all age groups. Among this group of youngsters, 92.5 per cent of South Asians originating from countries other than India, Nepal and Pakistan could read Chinese. In the same age group 83.1 per cent of Thais and 72.2 per cent of Filipinos could read.
When it came to speaking Cantonese, mixed-race people with a Chinese parent again were the most likely to be able to do so, with 72.3 per cent speaking the language. They were followed by Thais, at 72.2 per cent, and Indonesians at 71.4 per cent.
Who were the biggest earners?
White households earned the most among all ethnic minorities. Looking at the median monthly household income in 2016, the figure for all ethnic minorities was HK$32,500, compared to the city’s overall figure of HK$25,000. Whites earned HK$60,000 – the highest among all. They were followed by Koreans at HK$48,250 and Japanese at HK$40,000.
That could be due to more people from these ethnic groups working in better paid jobs. Among working non-Chinese people, 42.4 per cent of Japanese were managers and administrators, 36.7 per cent of whites and 35 per cent of Koreans.
Who were more likely to struggle with poverty?
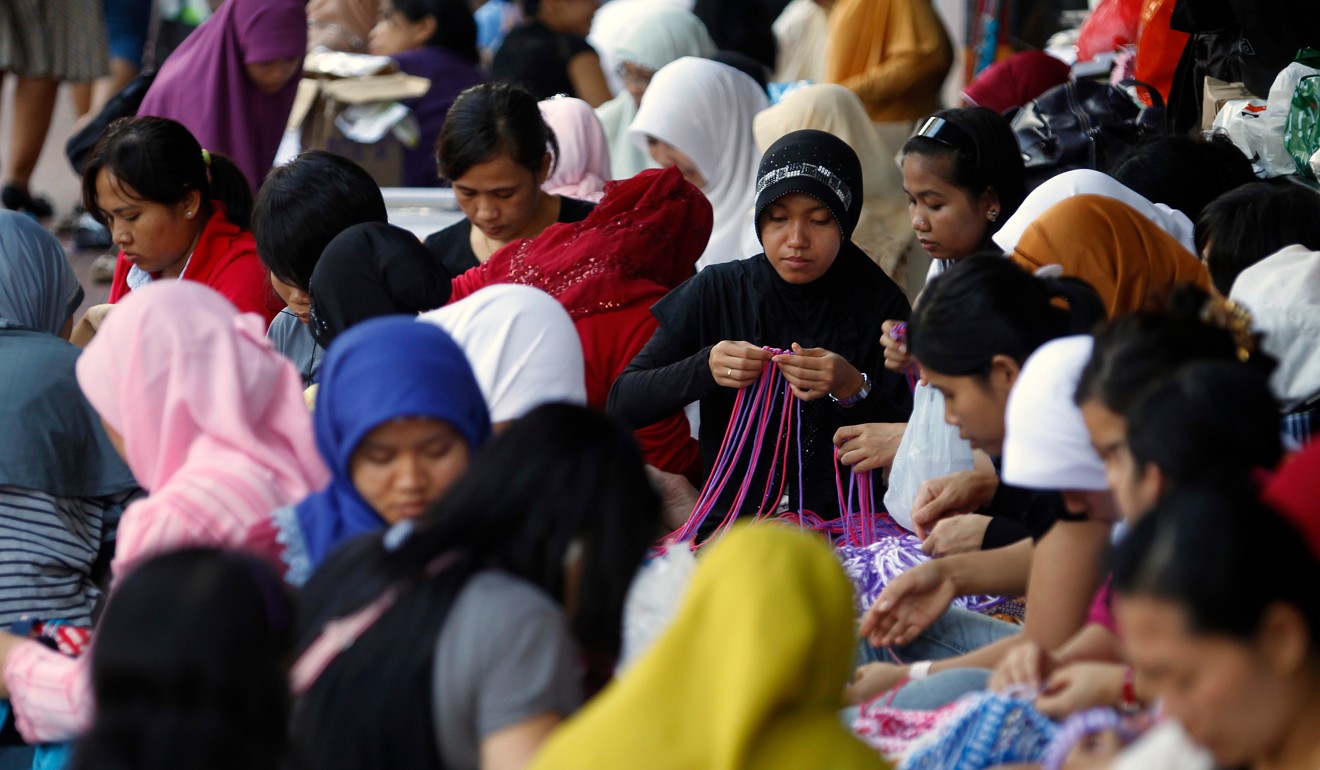
In contrast, other Asian households earned relatively less. The median monthly income for Indonesian households in 2016 was HK$9,250, the lowest among all. Separate research by the Legislative Council, released in June last year, pointed out that South Asians accounted for around half of the poor among ethnic minorities. For example, citing 2011 statistics, the Legco study pointed out Pakistanis had the highest poverty rate of 50.2 per cent, after receiving major social security payments.
The study attributed the poverty risk faced by South Asians partly to their larger family size. Most had families with at least four to five members, but were relying on around one person to work and give financial support.
Which districts did ethnic minorities usually stay in?
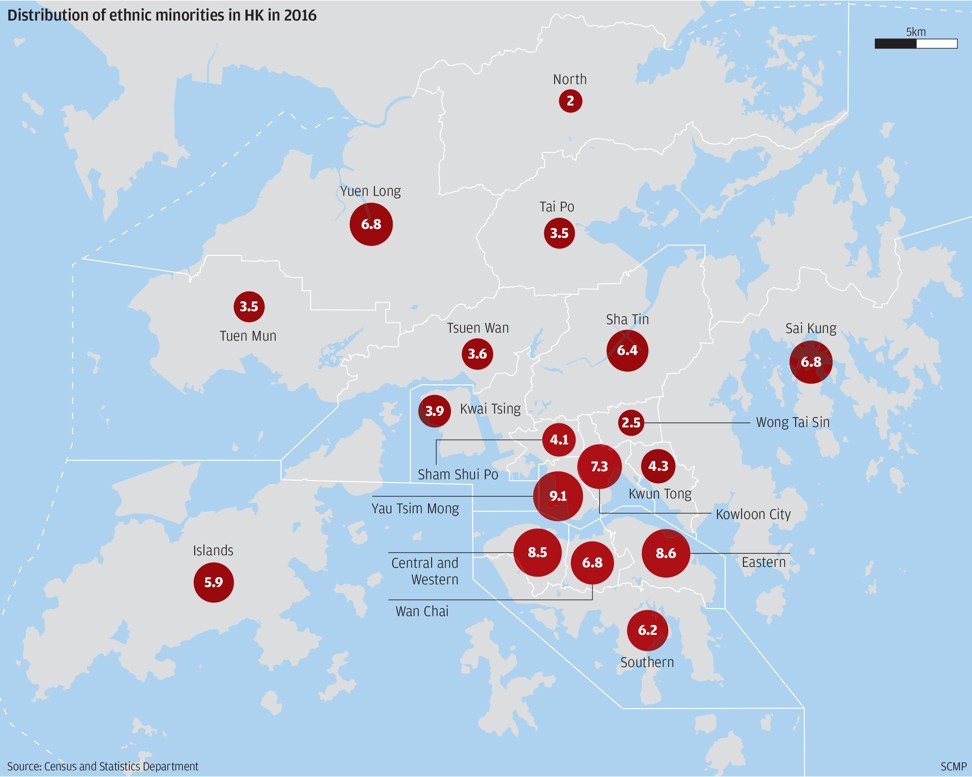
Yau Tsim Mong had most members of ethnic minorities living in it, as the district accommodated 9.1 per cent of the city’s non-Chinese population. Eastern district came the second, with 8.6 per cent, followed by Central and Western district.
But patterns of distribution varied, depending on ethnicity. More than half of whites and over 40 per cent of Koreans stayed on Hong Kong Island. On the other hand, close to 60 per cent of Nepalese and about 40 per cent of Indians, Japanese and Thais stayed in Kowloon. The New Territories had about half of Pakistanis and half of Indonesians.


