Graphic: SCMP


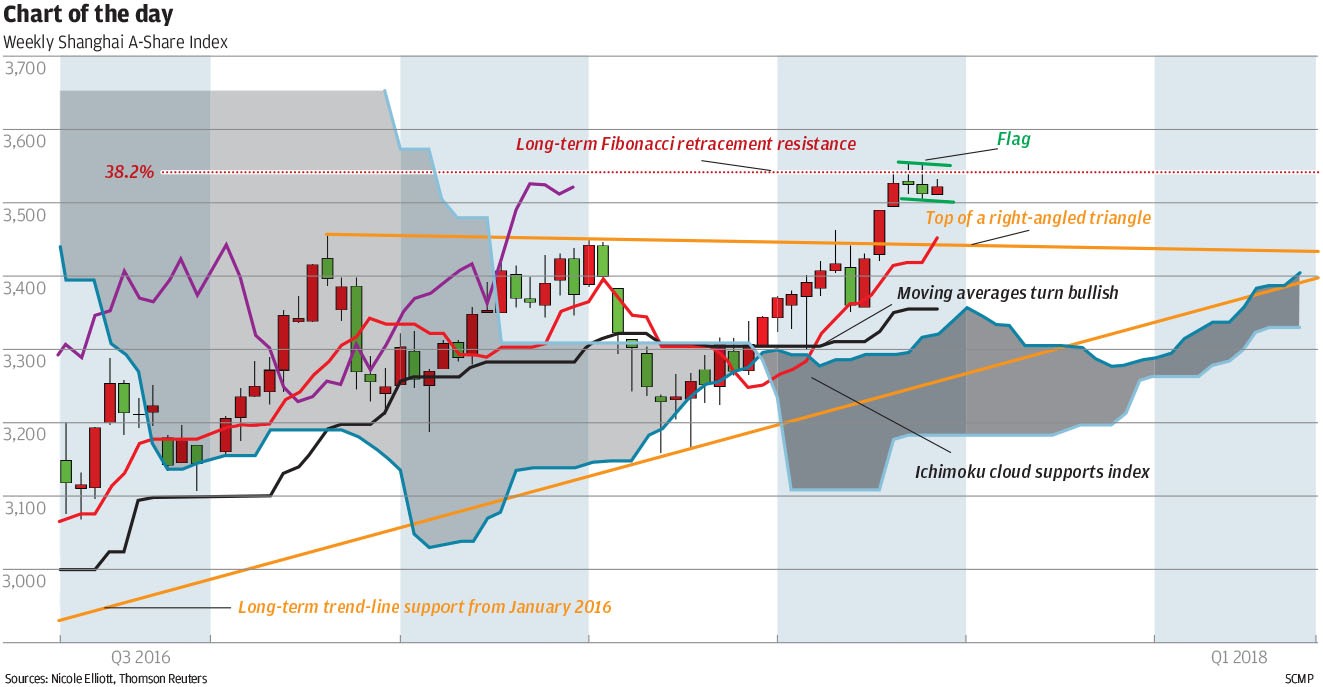
As we predicted at the beginning of August, the Shanghai A-Share Index on its third attempt broke above the top of the right-angled triangle that has dominated since late 2016. And as we had warned, it is now struggling at the 3,540-point area, a long-term Fibonacci retracement resistance level. Despite the tiny range of the past fortnight, which has seen observed volatility drop almost to a record low, volume has remained fairly steady at the higher levels of the past couple of years. If we combine the past two weeks with the three before that, we can see a bullish flag chart pattern with a measured target at 3,750 points – and a chance to overshoot.
Nicole Elliott is a technical analyst