Graphic: SCMP

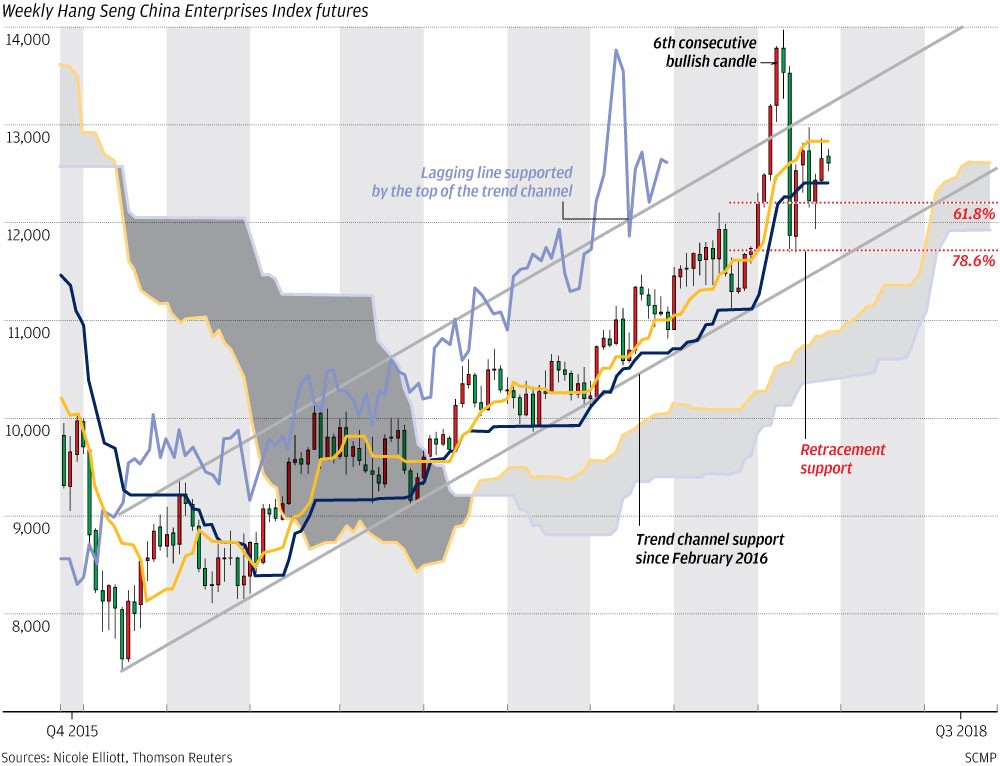
As we warned in late January, the sixth consecutive bullish weekly candle was a signal that this market’s character had changed. Observed volatility of the Hang Seng China Enterprises Index futures contract exploded from historically low levels at about 13 per cent to match 2015’s highs at 40 per cent. Ahead of important chart resistance at between 14,500 and 15,000 points, sentiment suddenly turned with the biggest weekly drop in years. Retracement support stemmed the flow, just ahead of trend channel support, and the neat consolidation since then saw volatility drop to its long-term mean at 18 per cent. We are now back inside the channel that started in 2016, and price action should revert to steady step-like rallies that have dominated this long rally.
Nicole Elliott is a technical analyst