Google map shows 29 years of change
Project uses decades of satellite images to highlight effects of development across earth
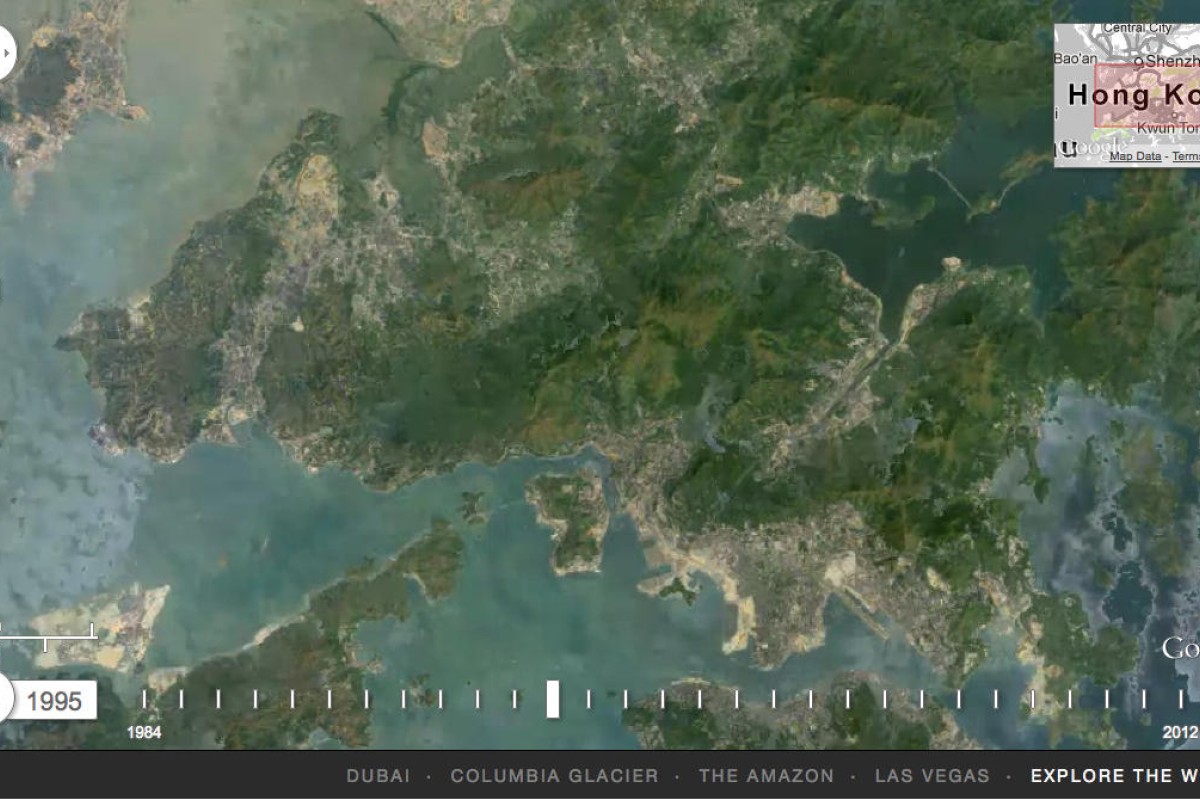
Ever wondered how much Hong Kong has changed since 1984? Google has teamed up with Time magazine, Nasa and the US Geological Survey to create time-lapse videos from satellite images of what's happened to the earth over the past 29 years.
In Hong Kong, Victoria Harbour shrinks from the reclamation work, while the Lamma power station changes the shape of that island. Islands form where there once were none as Chek Lap Kok takes over from Kai Tak as the city's international airport.
"These time-lapse pictures tell the pretty and not-so-pretty story of a finite planet and how its residents are treating it - razing even as we build, destroying even as we preserve. It takes a certain amount of courage to look at the videos, but once you start, it's impossible to look away," writes Jeffrey Kluger, senior writer at Time.
The Time feature also shows the growth of Dubai, once a desert and now one of the Middle East's modern cities, the growth of Shanghai, the effect of harvesting from oil sands in Canada, and the razing of the Amazon to make way for grazing pastures and farmland.
We sifted through 2,068,467 images - a total of 909 terabytes of data - to find the highest-quality pixels for every year since 1984 and for every spot on earth
Putting together the images gathered by Nasa and the US Geological Survey was no mean feat. "Using Google Earth Engine technology, we sifted through 2,068,467 images - a total of 909 terabytes of data - to find the highest-quality pixels for every year since 1984 and for every spot on earth," wrote Rebecca Moore, engineering manager with Google Earth Engine and Earth Outreach on the firm's blog. "We then compiled these into enormous planetary images, 1.78 terapixels each, one for each year."